Table of contents
- Introduction
- Logistics
- Learning objectives
- Getting the config
- Network topology
- 1. The ARP protocol
- 2. ICMP
- 3. Implementation tasks
Introduction
This lab serves as an introduction to networking and the basics of network security. Throughout this lab, you will be asked to generate, capture, and monitor network traffic, in an effort to understand the basic network protocols running at the data link and network layers. At the end of the lab, you will exploit the nature of the Address Resolution Protocol (ARP) to convince a victim machine that a non-existing device actually exists on the network.
Logistics
In addition to the tools we set up in the prelab, you will need the following:
- Wireshark to visually see packets and protocols.
- Install this on your local machine, so you can see things visually.
- If you are comfortable with command line, you can also use
tsharkto observe the same packets and protocols, directly on the server machine. scporrsyncwill prove to be useful to obtain packet captures from the server and download them on your local machine. They should be installed by default on your Linux distribution that you are running.
Learning objectives
After completing this lab, you should be able to:
- Identify the data link and network layer protocols.
- Capture traffic on a network using
tcpdumpand/orscapyand/orlibpcap. - Examine network packets captured on the wire.
- Craft and send network packets to achieve a certain objective.
Getting the config
To start with this lab, login to the class server, and navigate to your netsec-labs-username directory. Grab the latest updates using:
  (class-server) $ git fetch upstream
  (class-server) $ git pull upstream main
A folder called lab1 should show up in your directory, that is where you will do most of your lab.
Patching the docker file
As we did in the prelab, you will need to patch the docker-compose.yml file to be unique to your own experiment, and change addresses to use your assigned subnet. Recall that your assigned subnet can be found on the Moodle page for the class.
To do so, in the lab1 directory, run the patch script as follows:
(class-server) $ ./patch_docker_compose.sh user SUBNET
Replace user with your RHIT username and SUBNET with the subnet you got from Moodle.
In the remainder of this document, I will not be using your specific prefixes and subnets. For example, when I refer to hostA, you should replace that with user-hostA where user is your RHIT username. Similarly, I will be using 10.10.0 as the default subnet, you should replace that in all ip addresses with your own subnet. For example, if your subnet is 10.11.0, then replace the ip address 10.10.0.1 with 10.11.0.1.
Network topology
In this lab, we will be working with three machines connected to the same local network. They will live on the same subnet and all can access each other directly. The machines are:
hostAwith ip address10.10.0.4hostBwith ip address10.10.0.5attackerwith ip address10.10.0.13
Recall that yours will look slightly different based on your username and subnet.
 $ docker compose up -d
Once the experiment is up, have at least three terminal panes open in lab1 directory.
Capturing packets
First, we’d like to capture some packets on the network. To do so, we will make use of the tcpdump utility, already backed into the class containers. We will capture traffic on hostA for this first experiment.
Recall that to access one of the containers, you can use:
docker container exec -it hostA /bin/bash
Note that all containers are running a stripped down version of kali-linux. You will need two terminal windows on hostA and one on hostB.
On hostA, start a packet capture and dump the captured packet onto the volumes mounted directory as follows:
(hostA) $ tcpdump -i eth0 -w /volumes/hostA.pcap arp or icmp
This will ask tcpdump to listen on interface eth0, watch for two specific protocols that we care about, and write the captured packets into the file /volumes/hostA.pcap. Note that the terminal window will hang after you start tcpdump, that is normal as it is running and waiting for packets to come in.
If you’d like to stop tcpdump for any reason, simple hit C-c or ctrl and c on your keyboard in the terminal window where tcpdump is running, it will stop, write out a summary, and save the file /volumes/hostA.pcap.
Grab another terminal on hostA, and first, clear up some local caches to make sure we can grab all the packets we care about.
(hostA) $ ip -s -s neigh flush all
Once that is done, let’s try to ping hostB and see what packets can we capture. We will ping hostB twice.
(hostA) $ ping -c2 hostB
Now stop tcpdump by selecting that pane and hitting C-c, tcpdump will print out however many packets it was able to capture withe the filter that we gave it. On my end, here’s what the output was when I stopped tcpdump, your might vary depending on some timing issues.
  tcpdump: listening on eth0, link-type EN10MB (Ethernet), snapshot length 262144 bytes
  ^C6 packets captured
  6 packets received by filter
  0 packets dropped by kernel
Anytime you want to repeat this experiment, please make sure to clear the cache using ip -s -s neigh flush all, otherwise, you might not see everything we are looking to see here.
Reading the packet capture
Now, you can go and read the packet capture, you can use one of two tools to do so: tshark or wireshark.
If you are not familiar with tshark, I would recommend that you get started using Wireshark, as it a lot easier to use, and it would be very helpful to see the packets visually, and expand them to see their inner details.
Reading with tshark
tshark is a command line tool that allows you to do packet captures and reading of already captured packets. We will use it for the last purpose in this class and resort to tcpdump for the first.
To read the .pcap file generated from the previous exercise, on the class server machine, navigate to the volumes/ directory under lab1, you should see the file hostA.pcap show up there.
To read it using tshark, use the following:
  (class-server) $ tshark -r hostA.pcap
  ...
Reading with wireshark
To view the packet capture with wireshark, you will need to download a copy of the pcap file onto your local machine from the class server.
In what follows, we make the following assumptions:
- You have configured
sshauthentication using a public/private key pair. - You created an
sshconfig file and added a rule callednetsecfor accessing this class’s server. If you have not done so, please go back to the guides page and do these two steps.
From your local machine, grab a terminal window (make sure you’re running a *nix flavor, WSL2 will do or macOs). Create a new directory, I’ll call it data using mkdir data/ and change into it (cd data/).
Then in there, grab a copy of the pcap file from the server using:
(local) $ rsync -e ssh -Paz 'netsec:~/netsec-labs-user/lab1/volumes/*.pcap' .
Note that you will need to replace ~/netsec-labs-user/lab1/volumes/ with the path to your volumes directory on the class server.
This will sync all pcap files on the server with the ones you have locally, fetching only the ones that have been changed.
To make things faster and avoid retyping this command multiple times, I suggest you put it in a script and then call the script. Create a script, let’s call fetch_pcaps.sh and put the following in it:
  #!/usr/bin/env bash

  rsync -e ssh -Paz 'netsec:~/netsec-labs-user/lab1/volumes/*.pcap' .
Make the script executable using chmod +x ./fetch_pcaps.sh and then you can grab those pcap files using ./fetch_pcaps.sh anytime you need to get updates.
Now you can open hostA.pcap in Wireshark and look at the packets visually.
Lab sheet questions
Take a moment and examine the packets you have captured, and then answer the following questions on the lab question sheet:
- How many protocols have you captured? List them all (there should be 3).
- Before we see any
(ping)packets, there are two packets that show up in our capture. In your own words, describe what you think these packets are for?
Hint: You might find it useful to expand the Ehternet II header in Wireshark for the first two packets, and then expand that same header in the first ping packet and compare the values you are seeing there.
Hint: It is also worth while to look at the Ethernet headers in the ping request and ping reply packets, and compare the two.
Digging into ARP
Okay, let’s try to break down what the ARP protocol is trying to achieve. To do so, we will repeat the experiment with slightly different goals. For this one, you will need three terminals, all running on hostA.
In one of the terminals, let’s clear the caches and start a packet capture. This time, we would like to see things as they come in, instead of writing them to a file and then observing them later.
In one terminal, do the following:
  $ ip -s -s neigh flush all
  $ tcpdump -i eth0 arp or icmp
In another terminal window, check out what the arp table is holding on hostA:
$ arp -n
At this point, nothing should show up!
In the third terminal, send a ping request from hostA to hostB:
(hostA) $ ping -c1 hostB
Now from either terminals (not running tcpdump), check out the content of the ARP table using:
(hostA) $ arp -n
Now, let’s do one final thing, let’s try to ping the attacker machine from hostA. Then re-examine the content of the ARP table.
Lab sheet questions
Next, answer the following questions on the lab sheet:
- What is the purpose of the ARP protocol?
- Where are ARP mapping stored on a machine?
Workings of ARP
Let’s do one last experiment when it comes to the ARP protocol. We will need two terminals in this case, one on hostA and another on the attacker machine.
On the attacker machine, start a packet capture using:
(attacker) $ tcpdump -i eth0 arp
Then, on hostA, first clear the ARP cache and then ping hostB using:
  (hostA) $ ip -s -s neigh flush all
  (hostA) $ ping -c1 hostB
Observe the packets that are being capture on the attacker machine, what can you see? Repeat this experiment (clearing up the cache on hostA every time) until things start making sense to you.
One last step
Before we move on from ARP, let’s do one last thing. For this one, we need a terminal on each of the machines, i.e., one on attacker, one on hostA, and one on hostB.
On the attacker machine:
(attacker) $ tcpdump -i eth0 arp -w /volumes/attacker.pcap
On the attacker machine:
(hostB) $ tcpdump -i eth0 arp -w /volumes/hostB.pcap
On hostA, do:
  (hostA) $ ip -s -s neigh flush all
  (hostA) $ timeout 5m ping hostB
This time, hostA will continuously ping hostB until 5 minutes have passed. After the 5 minutes expire, stop both packet captures on hostB and attacker. Open the packet captures in Wireshark (remember to use the fetch script first) and compare what you see. We are specifically interested in two things:
- How often does
hostAsend requests forhostB’s address? - What is the difference between the very first request and the subsequent ones? Hint: Look at the destination MAC address.
Lab sheet questions
Finally, answer these last three questions about the ARP protocol:
- In your own words, describe how the ARP protocol operates. List the steps involved in obtaining a mapping from a given IPv4 address to a corresponding MAC address.
- On average, how often is an ARP request refreshed?
- Consider the following scenario:
hostAis pinginghostB, but all of a suddenthostBdies. In terms of ARP, what do you thinkhostAwill do after it askshostBdirectly for its MAC address and it doesn’t receive a response?
2. ICMP
At this stage, we’d like to look into the ICMP protocol. ICMP is a network control and management protocol that runs on top of IPv4. While it does not do any routing or traffic direction, it is still considered a network protocol (i.e., at the same level as IP), yet it sits at the top of the network layer, right at the edge of the transport layer. ICMP is mostly used for control and management operations in the network.
The ping
Based on what we have observed, when we use the ping command, the sender will send an Echo (ping) request packet, to which the receiver will reply with an Echo (ping) reply packet. To confirm this, go back to the hostA.pcap file that we generated in the very first experiment, and examine the ICMP packets in there.
Lab sheet questions
Based on your observations of ICMP in the previous exercises, answer the following question on the lab sheet:
- Draw a simple structure of an ICMP packet, stacking together the different headers that must present in the packet so that communication can happen successfully.
Deciphering an ICMP packet
Next, let’s try to understand what are the content of an ICMP Echo packet. Consider the scenario shown in the figure below.
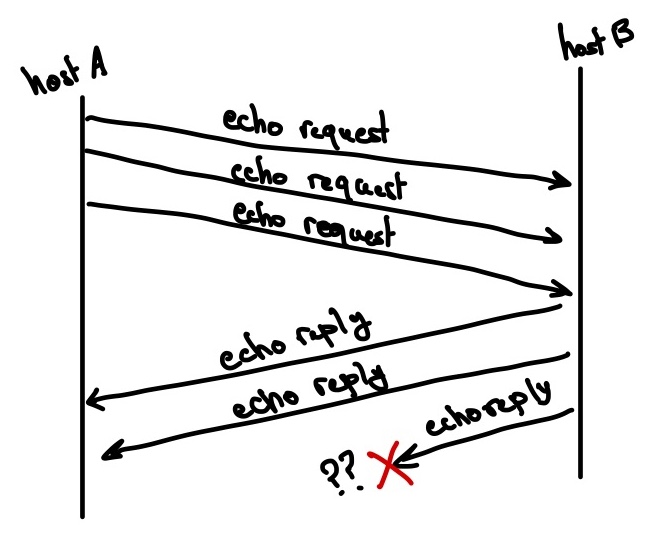
hostA has sent three ping packets to hostB, who has been slow to reply. Even worse, the last packet that hostB sends back ends up being lost. The question we are interested in answering is the following:
How can hostA know which of its Echo (ping) request packets went without response?
In other words, hostA has sent three requests, and it is interested in understanding which one of the corresponding replies was lost.
Lab sheet questions
In this step, you should design a simple experiment that does the following:
hostBis capturing packets oneth0; we are only interested in ICMP packets.Hint: To adjust the filter for
tcpdump, you simply can specify which protocol specifically you’d like to watch for. In previous steps, we usedarp or icmp, in this case, we are only interested inicmp.hostAwill send exactly 3 ping requests tohostB.- The
attackermachine should not play any role in this experiment.
You do not have to worry about injecting packet loss for hostB, that is not necessary.
After running your experiments, examine your packet captures and answer the following questions on the lab sheet:
- Describe the setup of your experiment and the commands you used to launch it.
- Examine the ICMP packet headers, based on your observations, how can
hostAmatchEcho (ping) replypackets received fromhostBto correspondingEcho (ping) requestpackets that it has sent.Hint: You only need to look at the ICMP header.
3. Implementation tasks
Now we come to the fun stuff. In this task we would like to do two things:
- Reverse engineer a protocol and re-implement it.
- Trick a machine to think that a non-existing host does exist on the network.
Before continuing here, checkout the scapy tutorial for sniffing and forging packets. We will stick to using python in this lab since it is already long enough.
Traceroute
Your next task is reverse engineer traceroute and re-implement it yourself. traceroute is a Unix utility that uses some properties of the IP and ICMP protocols to list all the hops on the route between a source and a destination.
For example, if I want to know the network hops between hostA and 1.1.1.1, then on hostA you can do the following:
  (hostA) $ traceroute 1.1.1.1
  traceroute to 1.1.1.1 (1.1.1.1), 30 hops max, 60 byte packets
   1  10.10.0.1 (10.10.0.1)  0.082 ms  0.028 ms  0.032 ms
   2  137.112.104.3 (137.112.104.3)  0.360 ms  0.360 ms  0.406 ms
   3  137.112.9.156 (137.112.9.156)  0.132 ms  0.128 ms  0.098 ms
   4  * * *
   5  199.8.48.102 (199.8.48.102)  2.253 ms  2.271 ms  2.239 ms
   6  ae-0.2022.rtr.ll.indiana.gigapop.net (199.8.220.1)  1.974 ms  3.016 ms  1.945 ms
   7  206.53.139.34 (206.53.139.34)  2.457 ms  2.940 ms  2.965 ms
   8  one.one.one.one (1.1.1.1)  2.025 ms  1.989 ms  1.962 ms
Note that your output might be different; network paths often change depending on the state of the network.
Lab sheet question
In what follows, use the tools we have learned to do the following:
Describe an experiment in which you can capture packets to examine
tracerouteand reverse engineer its operation.Based on the outcomes of your experiment, how does
traceroutedetermine the hops on the path betweenhostAand1.1.1.1.
Here are a bunch of hints:
- You only need to use one machine, say
hostA. - It is advisable to use Wireshark instead of tshark.
- To help you eliminate packets that we are not interested in, you can use the following
tcpdumpfilter command:(hostA) $ tcpdump -i eth0 ip or icmp and not port 53 -w /volumes/traceroute.pcapThis will filter out DNS packets that we are not interested in; we only care about IP and ICMP.
- BIG HINT: Look at the
TTL(or Time To Live) field in the IP header of packets sent byhostA. - To follow a certain packet and see only the responses corresponding to it in Wireshark, right click on the packet of interest, and then select
Follow -> *** Stream, where***refers to a protocol name. - Look at the differences between the ICMP packet sent from the destination (i.e.,
1.1.1.1) and how it is different from those sent from hops on the path.
Ghost machine
In this last task, we would like to convince hostA that a ghost machine exists on the network. Here’s the scenario, it will only involve hostA and the attacker machines.
We have convinced hostA that amazon.com has IP address 10.10.0.10 (remember to replace 10.10.0 with your subnet). Before sending its credit card information to it, hostA wants to make sure that 10.10.0.10 actually exists on the network (you can never be too careful). Therefore, it is in our interest as attackers to trick hostA into believing that 10.10.0.10 is indeed on the network, and it can send its credit card information over.
Your task is to design an experiment and write an exploit that will trick hostA into believing that 10.10.0.10 exists on the network, and that it is none other than the attacker machine. After that, all traffic generated from hostA and going to 10.10.0.10 will actually go to the attacker machine.
Lab sheet question
In what follows, use the tools we have learned in this lab to do the following:
- Describe your exploit using text and/or diagrams. Make sure to list all the steps that the attacker machine must do in order to trick
hostA. - Implement your exploit using your chosen programming language.
On my machine, after implementing the exploit, here’s what happens:
(attacker) $ ./exploit.py
On hostA:
  (hostA) $ ping -c3 10.10.0.10
  PING 10.10.0.10 (10.10.0.10) 56(84) bytes of data.
	64 bytes from 10.10.0.10: icmp_seq=1 ttl=64 time=29.0 ms
	64 bytes from 10.10.0.10: icmp_seq=2 ttl=64 time=28.0 ms
	64 bytes from 10.10.0.10: icmp_seq=3 ttl=64 time=27.0 ms

	--- 10.10.0.10 ping statistics ---
	3 packets transmitted, 3 received, 0% packet loss, time 2002ms
	rtt min/avg/max/mdev = 27.018/27.997/29.010/0.813 ms
If you see a packet that says Redirect Host (New nexthop: 10.10.0.10), that is okay, it still counts. It has to do with python not being fast enough sometimes (You can clearly see that in the round trip time, rtt, from the sequence above, it is about 28ms on a local, virtual, network).
Hints
Here are some possible things to look out for:
- Set up a small experiment and observe the behavior of
hostAwhen it is trying to ping a non-existent host. Specifically, we are interested in the packets that show up at theattackermachine. - If you are using
scapywithpython, be aware that it also captures packets that are sent from the machine running the exploit itself. Make sure to ignore those or else you’d fall into an infinite loop. - Avoid hardcoding MAC addresses as those might change when you take down and then restart the docker environment. To get the MAC address of a certain interface, you can use
get_if_hwaddr("eth0"). - You will need to send packets at two different protocols.